Setting up a seedbox at home and geeking out with it
Obligatory disclaimer: I do not condone sharing copyrighted material on the internet. I encourage you to support the authors of the works you enjoy. Downloading and sharing copyrighted material for personal use is legal in some countries and not legal in others. If this guide inspires you to take any action, please make sure you know what you’re doing.
Now with that out of the way…
The story with BitTorrent⌗
Growing up as most teenagers do, I had no money and I loved music. In the early to mid 00s there was no Spotify or YouTube – we had portable CD players, and later we had USB mp3 players. If you were a lucky kid you had an iPod.

I did not have an iPod.
But I did have a CD player, and I liked Limp Bizkit and Papa Roach. To get the songs you could buy the CD or you could put your pirate eye-patch on and go on an adventure.
With no money and a passion for music, the circumstances made 14 year-old me an adventurer on the Internet. I stumbled upon suprnova.org, Mininova, The Pirate Bay, various Russian forums, eMule, Soulseek and a variety of other software. But Torrents were what I liked and used the most.
One thing always bothered me though: I could never seed the torrents properly. I had dial up until 2004, then ADSL, then by various other slow internet connections afterwards. All of them too slow to upload the stuff back.
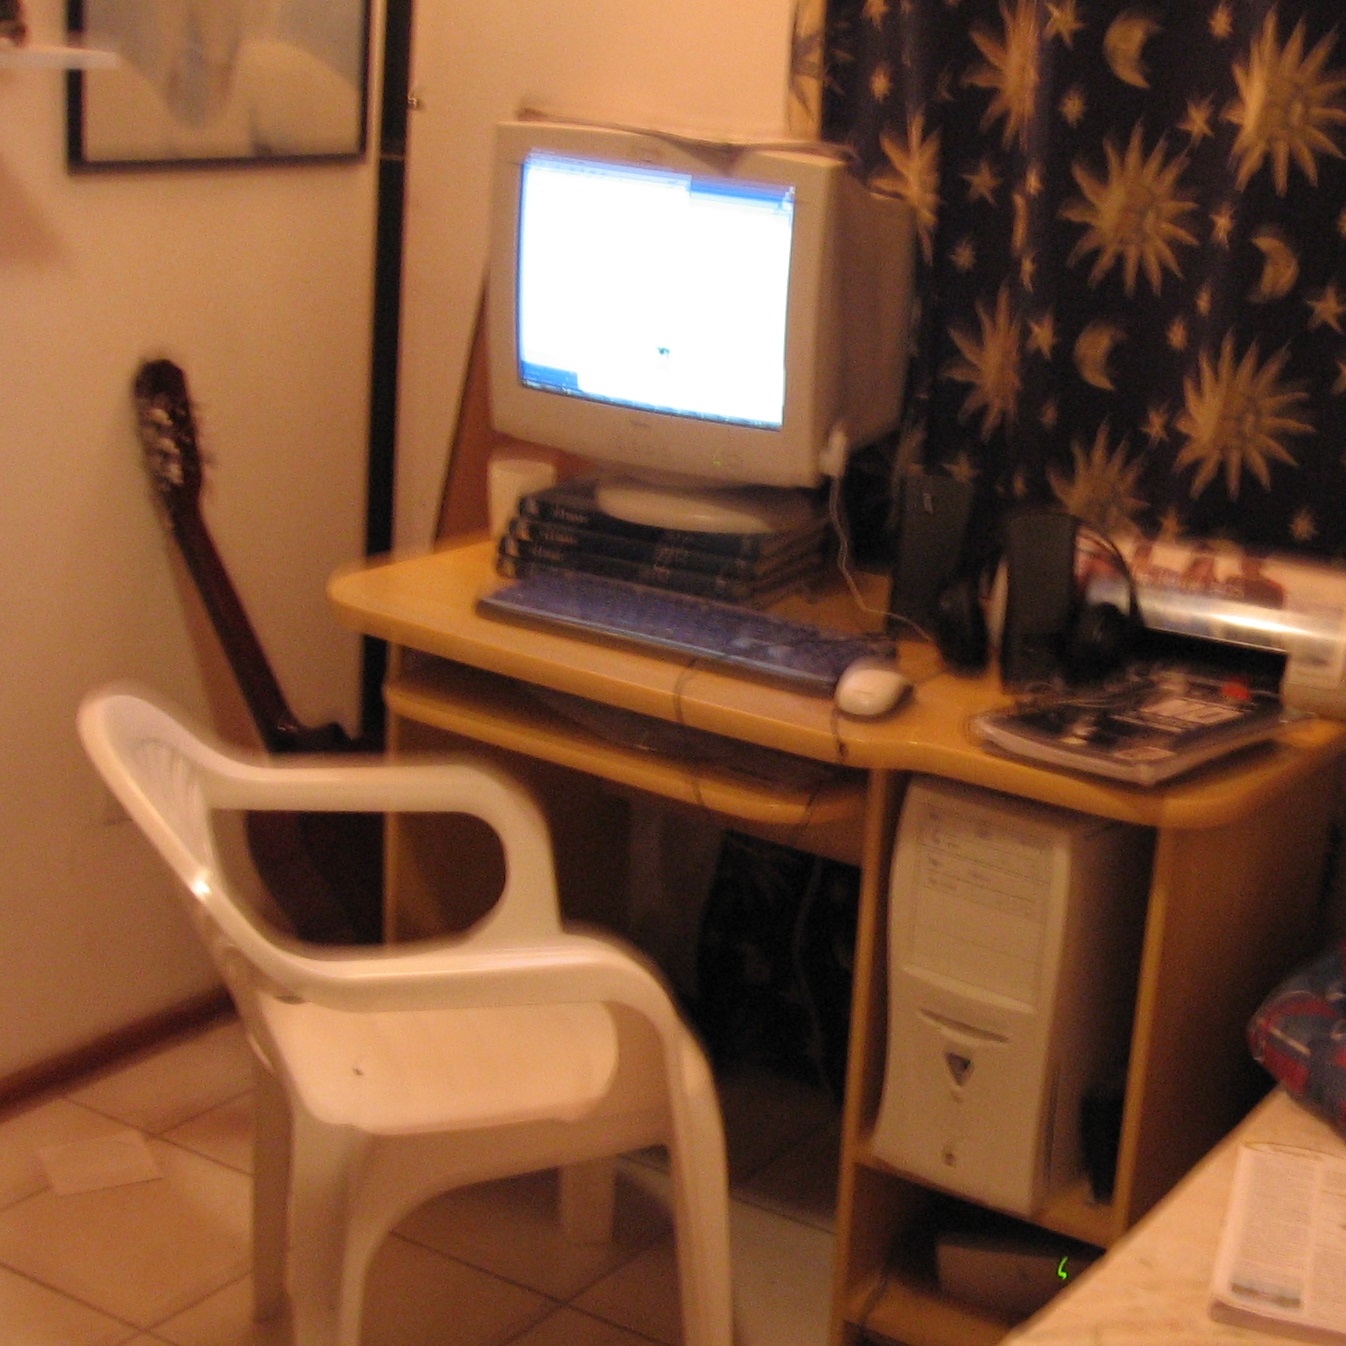
The oldest picture I could find of my first computer, some time in 2005. With 160kbps ADSL, hell yeah.
Well, its 2023 now and I have a 500mbps of symmetrical fiber at my place. It’s time give to back to my friends on the Internet. 🤘
The Hardware⌗
I started out wanting a Raspberry Pi for this, but their price as of late 2022 was waaay too high since the supply chain issues of 2020.
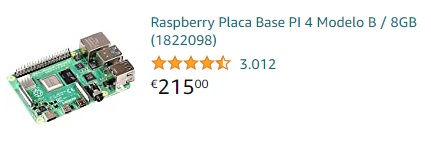
215€ for the 8gb model? Wew, its a pass.
I could also get an Orange Pi for about 120€:
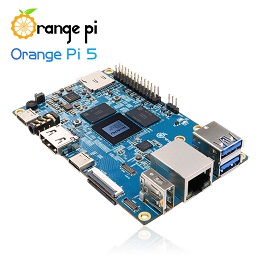
The Aliexpress equivalent of the Raspberry Pi 4.
This still felt too expensive for a board computer. The SD-card based I/O always annoyed me with those. apt-get upgrade takes a bazillion years and ain’t nobody got time for that.
So I went searching on eBay and Amazon for something second hand. A full tower would be too power hungry, but a board computer too slow. HmmMmMmm…
Eventually, I stumbled upon a refurbished Fujitsu Esprimo Q920. It was priced well, wasn’t too big, and didn’t use too much power:
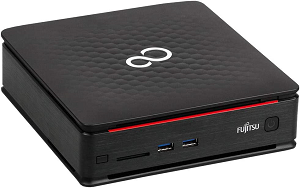
Core i5 4590T, 8gb of ram, 240gb SSD with ‘ultra low power consumption’ for 123€. That does it, let’s go.
So I bought it! And here it is a few days later in its natural habitat. Messy cables are part of the fun!
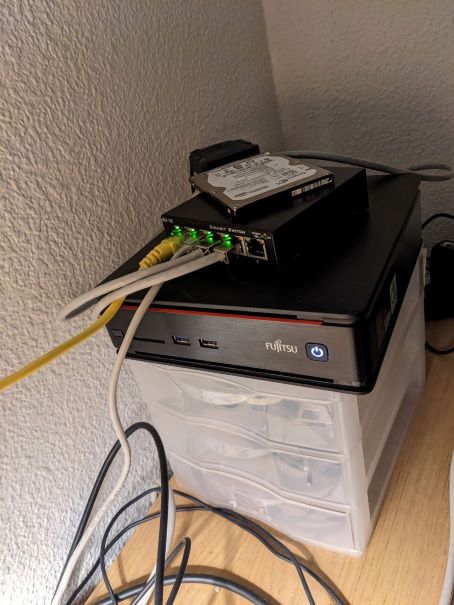
Power consumption averages at about 20w. That’ll be around 3.60€ per month in power when powered on 24/7, not too bad.
The software⌗
I installed Ubuntu server with the legacy installer (new installer was terrible, ubuntu pls), followed by upgrading to the latest version, followed by installing transmission, followed by installing a bunch of misc packages (ssh git vim docker wget etc) followed by some router port forwarding and/or VPN set up and I could end this post here but…
daniel@fujitsu:~$ cowsay "I'm here to nerd out. This is not nerdy enough."
 _________________________________________
/ I'm here to nerd out. This is not nerdy \
\ enough.                                 /
 -----------------------------------------
        \   ^__^
         \  (oo)\_______
            (__)\       )\/\
                ||----w |
                ||     ||
Monitoring: Prometheus & Grafana and an exporter or two⌗
If you parachuted in here with no technical background and have no idea what those are, allow me to confuse you even further:
- Prometheus is a monitoring tool
- Grafana is a graphing tool (it shows pretty graphs with the data Prometheus has).
- An exporter is a program that makes data available for Prometheus to ingest. node_exporter makes data from a given computer (aka node) available (things like cpu and memory usage)
node_exporter⌗
I wanna know more about resource usage on little Fujitsu. Let’s get some metrics going with the Prometheus node exporter to later import them into Prometheus.
My idea was to run everything inside containers, though the docs recommended me not to do that if I could avoid it, so lets run this exporter the old fashioned way. Ubuntu/Debian packages can be old and Cloud Native software gets released quickly, a quick check shows:
apt-get update
apt-cache search node-exporter
apt-cache show prometheus-node-exporter
(Version: 1.3.1-1.) <- Not as bad as I thought!
Latest release on GitHub is 1.5.0. I want the latest version ‘cause I’m fancy, let’s install it from there:
wget https://github.com/prometheus/node_exporter/releases/download/v1.5.0/node_exporter-1.5.0.linux-amd64.tar.gz
tar -xvzf node_exporter-1.5.0.linux-amd64.tar.gz
cd node_exporter-1.5.0.linux-amd64

sudo su
cp node_exporter /usr/bin

cat << EOF > /etc/systemd/system/node_exporter.service #systemd set up
[Unit]
Description=node_exporter service

[Service]
ExecStart=/usr/bin/node_exporter

[Install]
WantedBy=multi-user.target
EOF

systemctl start node_exporter
systemctl enable node_exporter
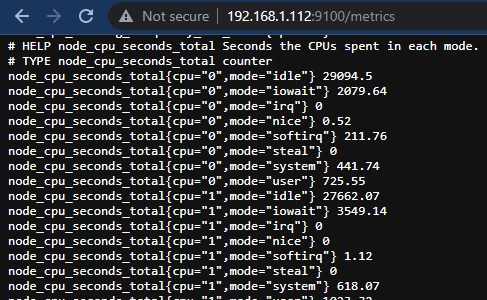
node_exporter exporting metrics on port 9100. I love the smells of metrics in the morning.
Prometheus⌗
The rest of the stuff I’m going to launch using Docker containers. Looks like Docker has been falling from grace for a while now. I wonder if Docker has still got it.
Let’s write a Prometheus config to scrape node_exporter into /home/daniel/prometheus/prometheus.yml and then put that inside a container running Prometheus:
global:
  scrape_interval: 15s
  scrape_timeout: 10s
  evaluation_interval: 15s
scrape_configs:
  - job_name: prometheus
    honor_timestamps: true
    metrics_path: /metrics
    scheme: http
    follow_redirects: true
    enable_http2: true
    static_configs:
      - targets:
          - localhost:9090
  - job_name: node
    metrics_path: /metrics
    static_configs:
      - targets:
          - 192.168.1.112:9100
And then launching the container with a few settings:
mkdir -p /home/daniel/prometheus/data
docker run -d \
    --restart unless-stopped
    -u 1000:1000 \
    -p 9090:9090 \
    -v /home/daniel/prometheus/prometheus.yml:/etc/prometheus/prometheus.yml \
    -v /home/daniel/prometheus/data:/prometheus \
    prom/prometheus
Oh the above command:
--restart unless-stoppedmakes it work like a system service: Always running-u 1000:1000makes the container run as my user (daniel) so it can write to my home directory- The first
-ventry copies the config to the container - And the second
-ventry makes the prometheus data directory persistent across container reboots
Hey noice! It works alrite – Docker is still cool in my book.
Grafana⌗
Let’s repeat this process and get a Grafana instance going:
mkdir -p /home/daniel/grafana/data
docker run -d \
    --restart unless-stopped \
    -u 1000:1000 \
    -p 3000:3000 \
    -v /home/daniel/grafana/data:/var/lib/grafana  \
    grafana/grafana-oss
We can then configure Prometheus as a data source, add the node_exporter dashboard from grafana.com and uh-oh, pretty graphs!
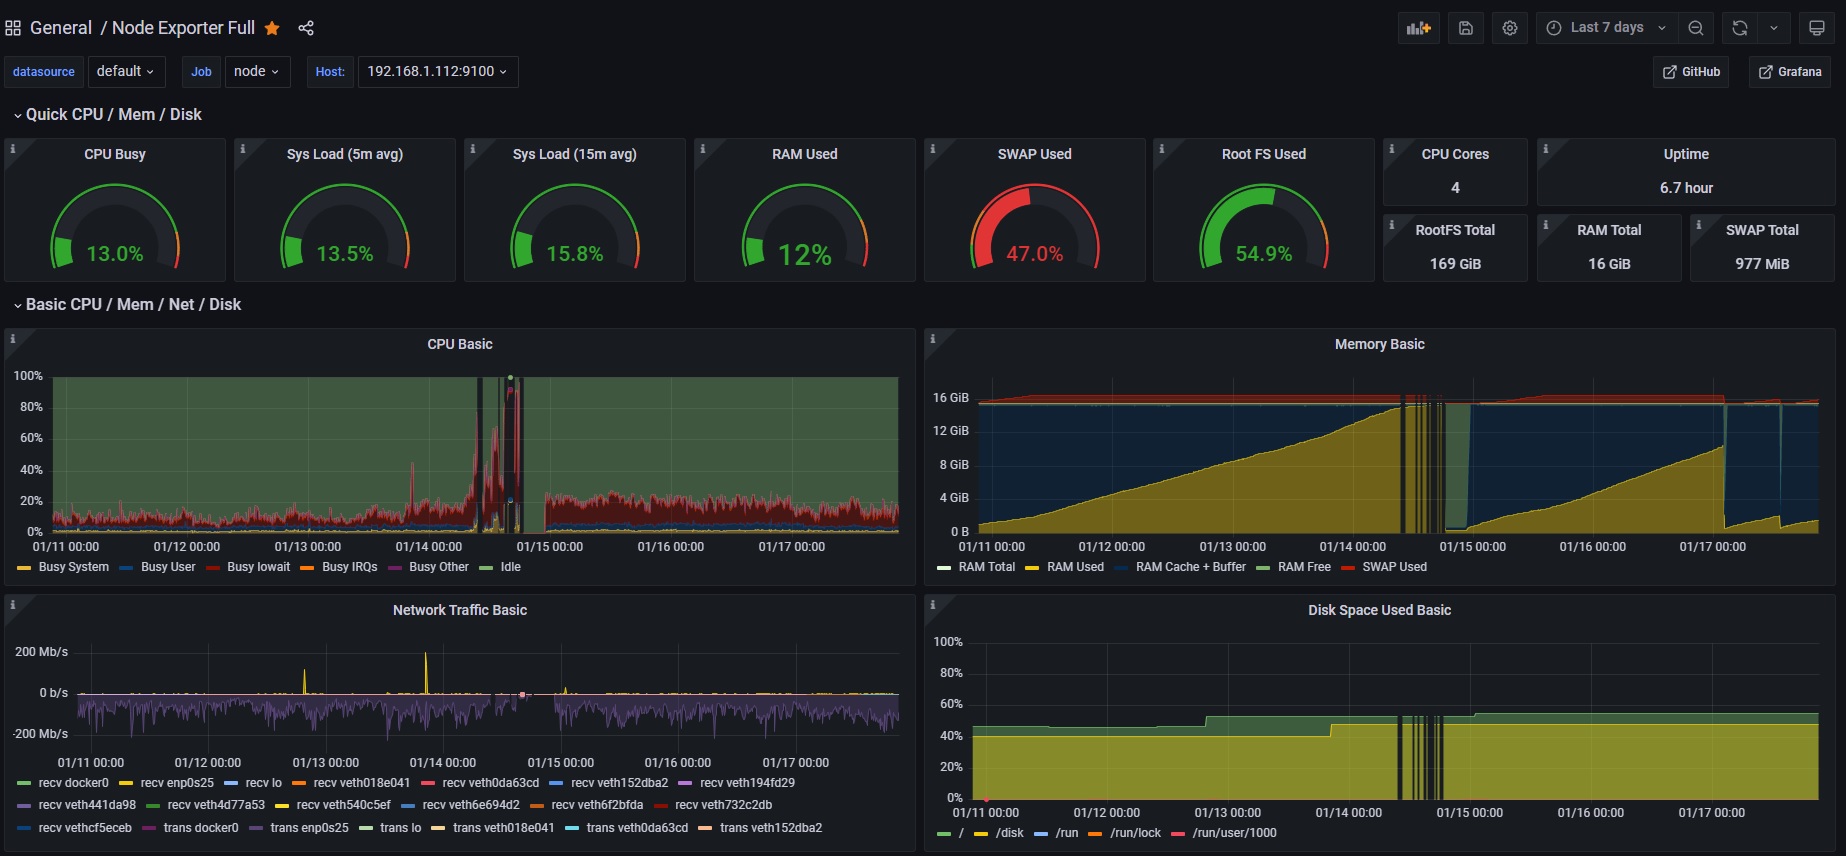
Looks like transmission has a memory leak...
This article could end here again but I’m having fun. I want more graphs detailing my seedboxing shenanigans.
Metrics on seedboxing⌗
My initial idea was to write my own exporter for transmission. Then I found one written in Go that seemed cool: metalmatze/transmission-exporter. Then I couldn’t get it to work. Then I started the debugging. Then I wasn’t sure what to do with it for a while.
I ended up forking it and now I have my own fork with some small changes that work for my use case.
Launching it is similar to what we’ve done before, but this time we have to clone and build it first:
git clone git@github.com:DanielCalvo/transmission-exporter.git
cd transmission-exporter
docker build . -t transmission-exporter
docker run -d \
    --restart unless-stopped \
    -p 19091:19091 \
    -e TRANSMISSION_ADDR='http://192.168.1.112:9091' \
    -e TRANSMISSION_USERNAME=transmission \
    -e TRANSMISSION_PASSWORD=transmission \
    transmission-exporter
Docker runs on its own network (172.17.x.x), so we must whitelist that on the transmission daemon configuration:
"rpc-whitelist": "192.168.*.*,127.0.0.1,172.17.*.*",
And then add a few extra lines to our Prometheus configuration:
  - job_name: transmission-exporter
    static_configs:
      - targets:
          - 192.168.1.112:19091
Then we can add the dashboard that comes with the exporter to Grafana aaand:
![]()
All I got was a graph with upload speeds per torrent. That's a tad underwhelming.
I should try putting some better graphs together sometime. Or maybe add more metrics to the transmission-exporter, or maybe even make some stats public but…
I think I’m gonna stop here. This was an okay amount of nerding out, I’m seeding my torrents and I got some pretty graphs. There are other cool things still to do!
Fancy graphs aside, what I meant to say is:⌗
If you can, seed your torrents. You might be giving something precious to some adventurous teenager in some obscure corner of the world.
~ Daniel